
SNACK: 3-line summary
- Cloudflare has opened its BEACON real-user web-performance dataset.
- It measures loading, responsiveness and visual stability, including slower-tail results.
- The data is updated daily in Google BigQuery, but it does not cover every site or work as a speed test for an individual URL.
A page that opens quickly on a developer’s laptop may still leave someone waiting for content or a response to a tap. Cloudflare’s BEACON makes patterns in those real-world delays publicly available, using anonymized measurements from large sites on its network.

Snackgirls react
AIKO: I’d compare the 75th and 95th percentiles for responsiveness. How much rougher does the slow tail get?
Nea: I’m picturing a page on an older phone: the content appears, but the first tap still feels late. I’d be curious which part of the wait stands out.
A public dataset, not a speed-test app
BEACON expands the community-led RUM Archive with measurements from 10,000 large websites on Cloudflare’s network. Updated daily in Google BigQuery, the dataset collectively represents billions of measurements. It is for people who can query the data—not a tool for checking any individual URL, and not a measure of every website.
What happens beyond the 75th percentile?
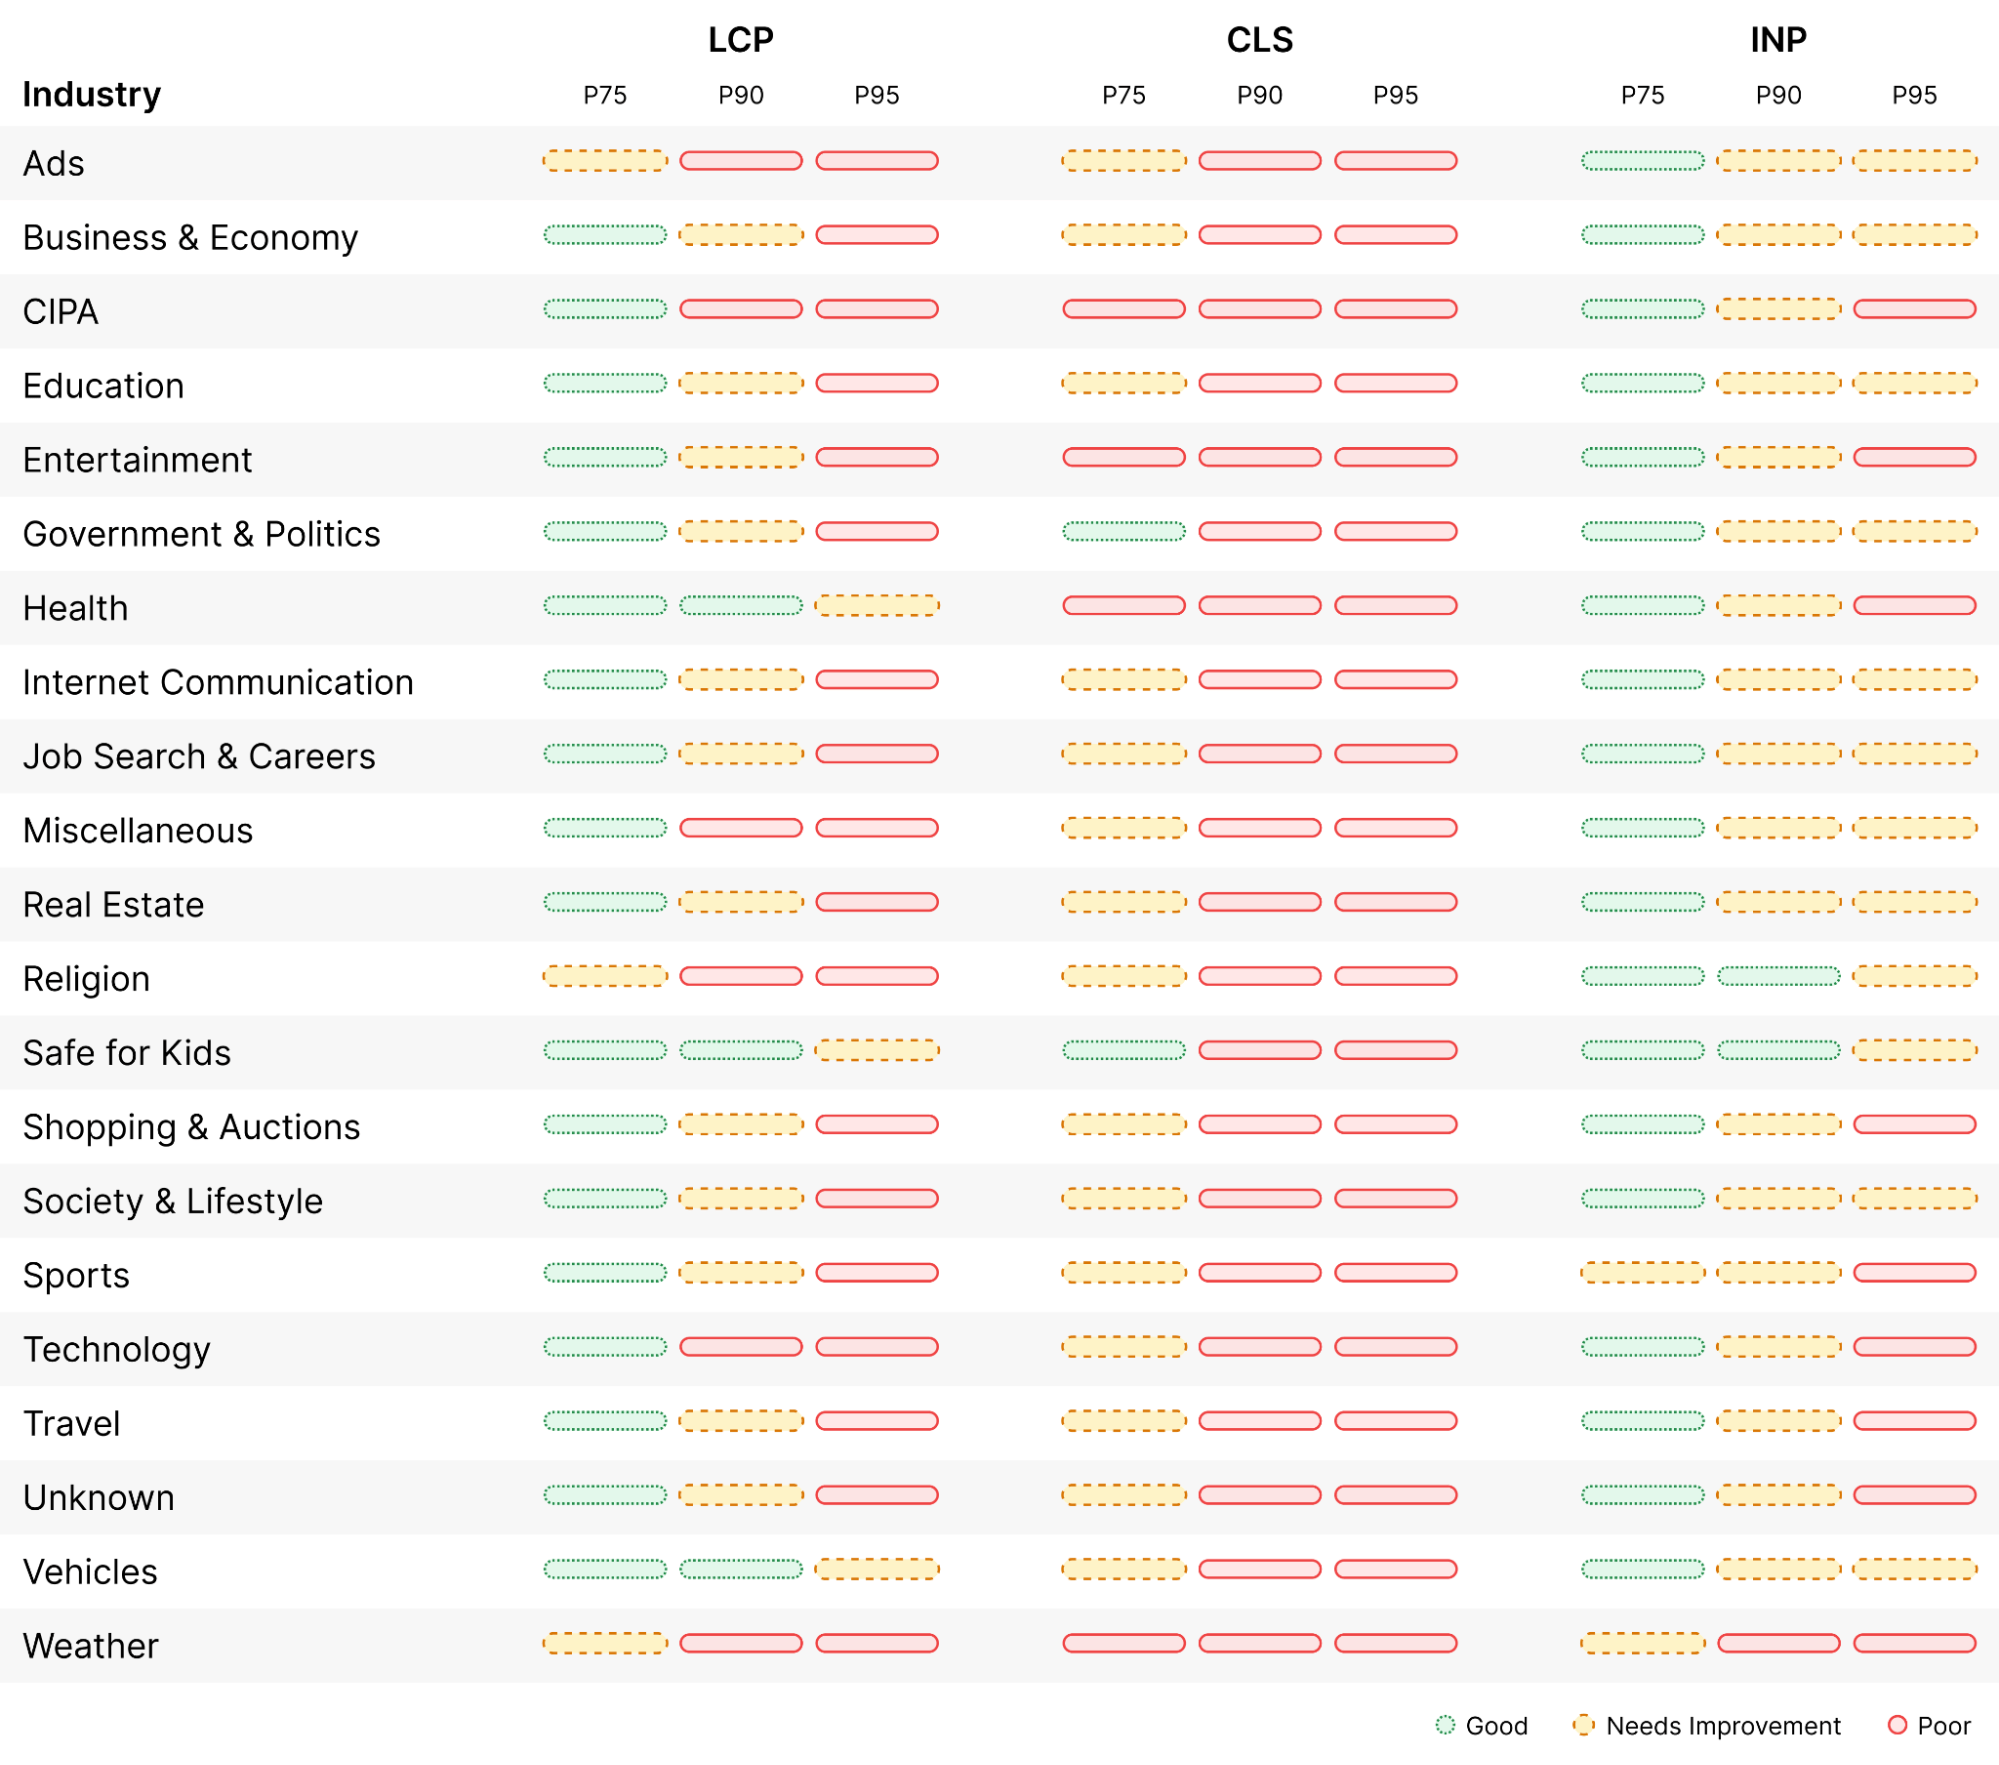
BEACON records three Core Web Vitals: Largest Contentful Paint (LCP) for loading, Interaction to Next Paint (INP) for responsiveness, and Cumulative Layout Shift (CLS) for visual stability. Its histograms allow comparisons at the 75th percentile and farther into the slow tail. In Cloudflare’s industry comparison, advertising, religion and weather sites tend to fare worst across the reported 75th, 90th and 95th percentiles; that does not mean every site in those categories is slow.
The wait is not always the download
Cloudflare reports that downloading a resource typically contributes the least to poor LCP results; finding that resource and rendering it are often larger opportunities for improvement. For a slow interaction, both JavaScript execution and presenting the result can contribute. The dataset shows broader patterns, not the cause of a delay on a particular visit.
Patterns without naming websites
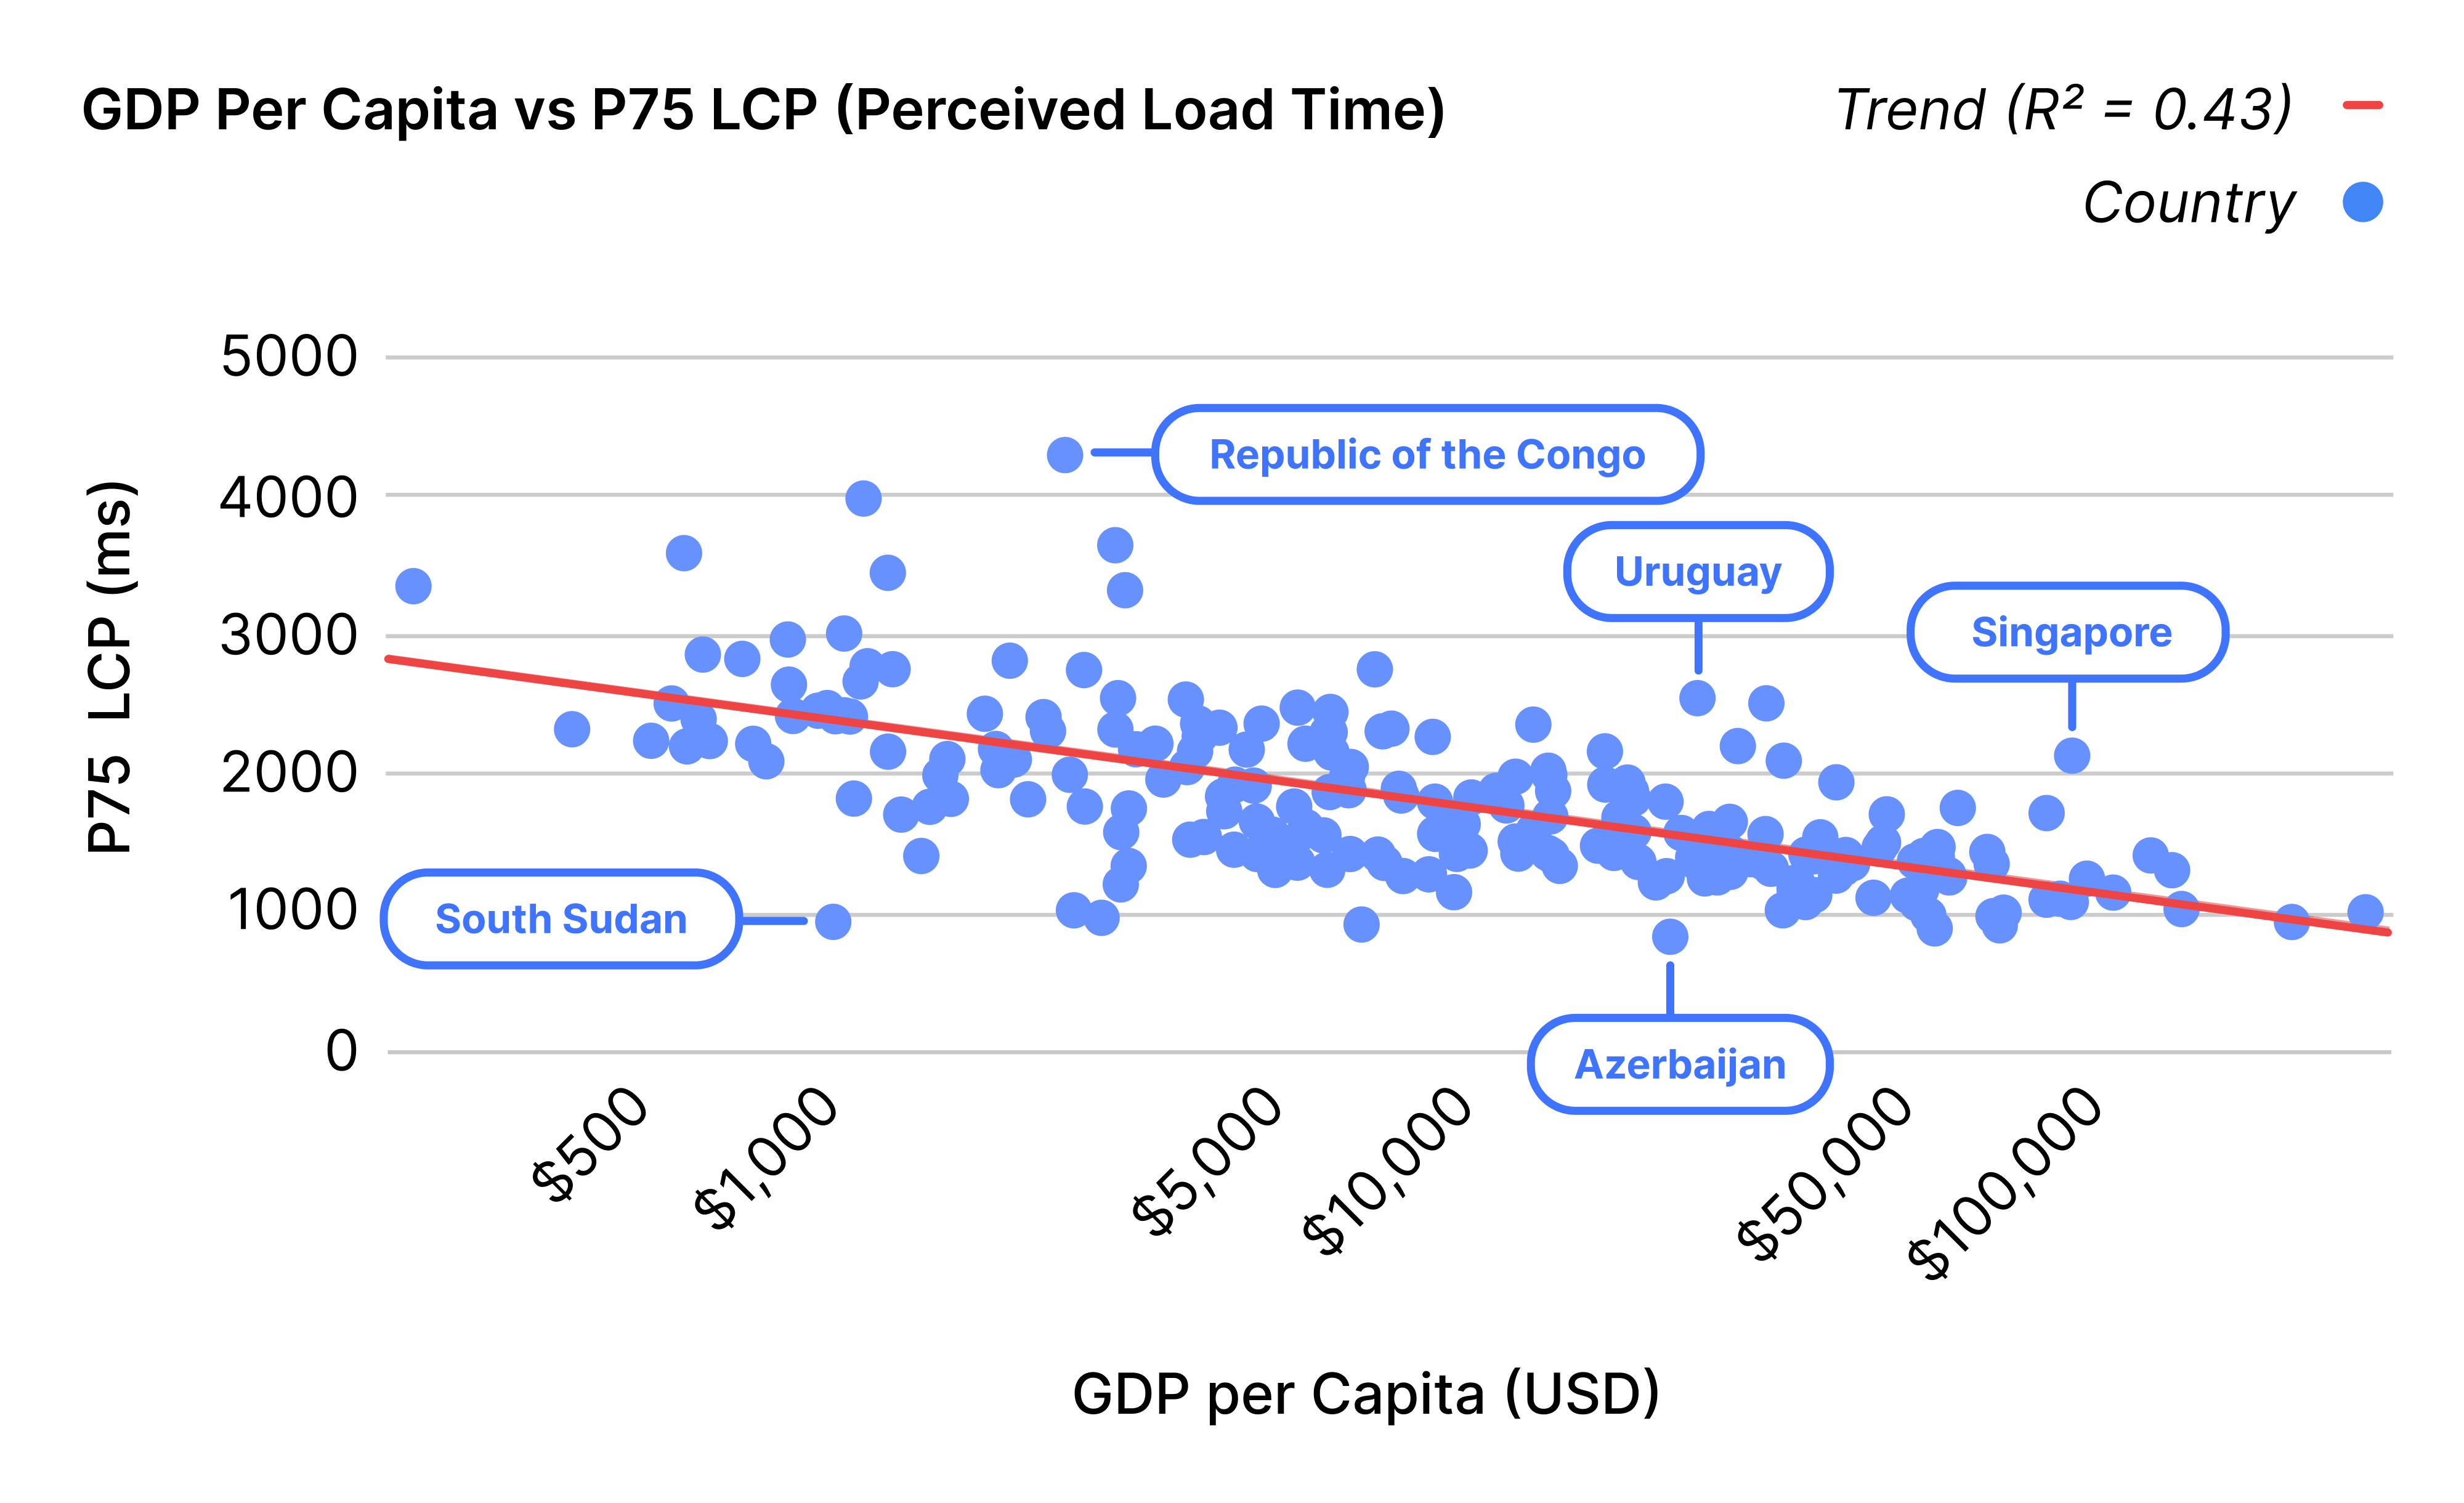
BEACON removes domain names and URL paths and drops aggregates with fewer than five points. Cloudflare also charts a correlation between GDP per capita and 75th-percentile LCP; the chart does not show that income causes pages to load faster. A BEACON-powered Web Performance section of Cloudflare Radar, also using its Internet Quality Index, is planned but is not yet live.
Sources and checked date: Cloudflare · September 29, 2026