
SNACK: 3-line summary
- Cloudflare Workers and Durable Objects now support on-demand CPU and memory profiling in production.
- Interactive flamegraphs show resource use by function, and profiles can be downloaded for further analysis.
- Captures must be started manually, and a Worker needs enough traffic for a successful capture.
Cloudflare announced on October 9, 2026, that developers can now capture CPU and memory profiles from Workers and Durable Objects running in production. The profiles help identify which functions are consuming resources under real traffic, beyond what logs and aggregate metrics show.
Snackgirls react
AIKO: A named function gives me somewhere to investigate when CPU usage climbs. Accusing the entire application is an inefficient search strategy.
Nea: I’d like to trace the Prometheus path Cloudflare thought was disabled but was still allocating memory. I’m curious about which parts had quietly kept running.
Capture from the dashboard or CLI
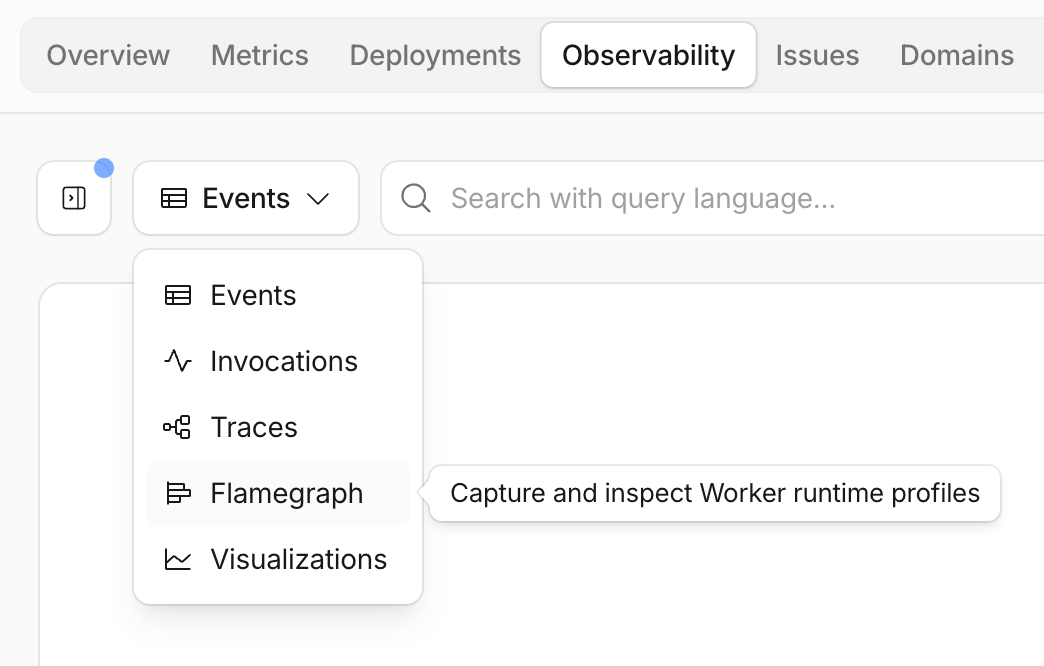
You can start a profile through the Workers Observability dashboard or the cf CLI. In the dashboard, follow Build → Compute → Workers & Pages, select your Worker, open Observability, and choose Flamegraph.
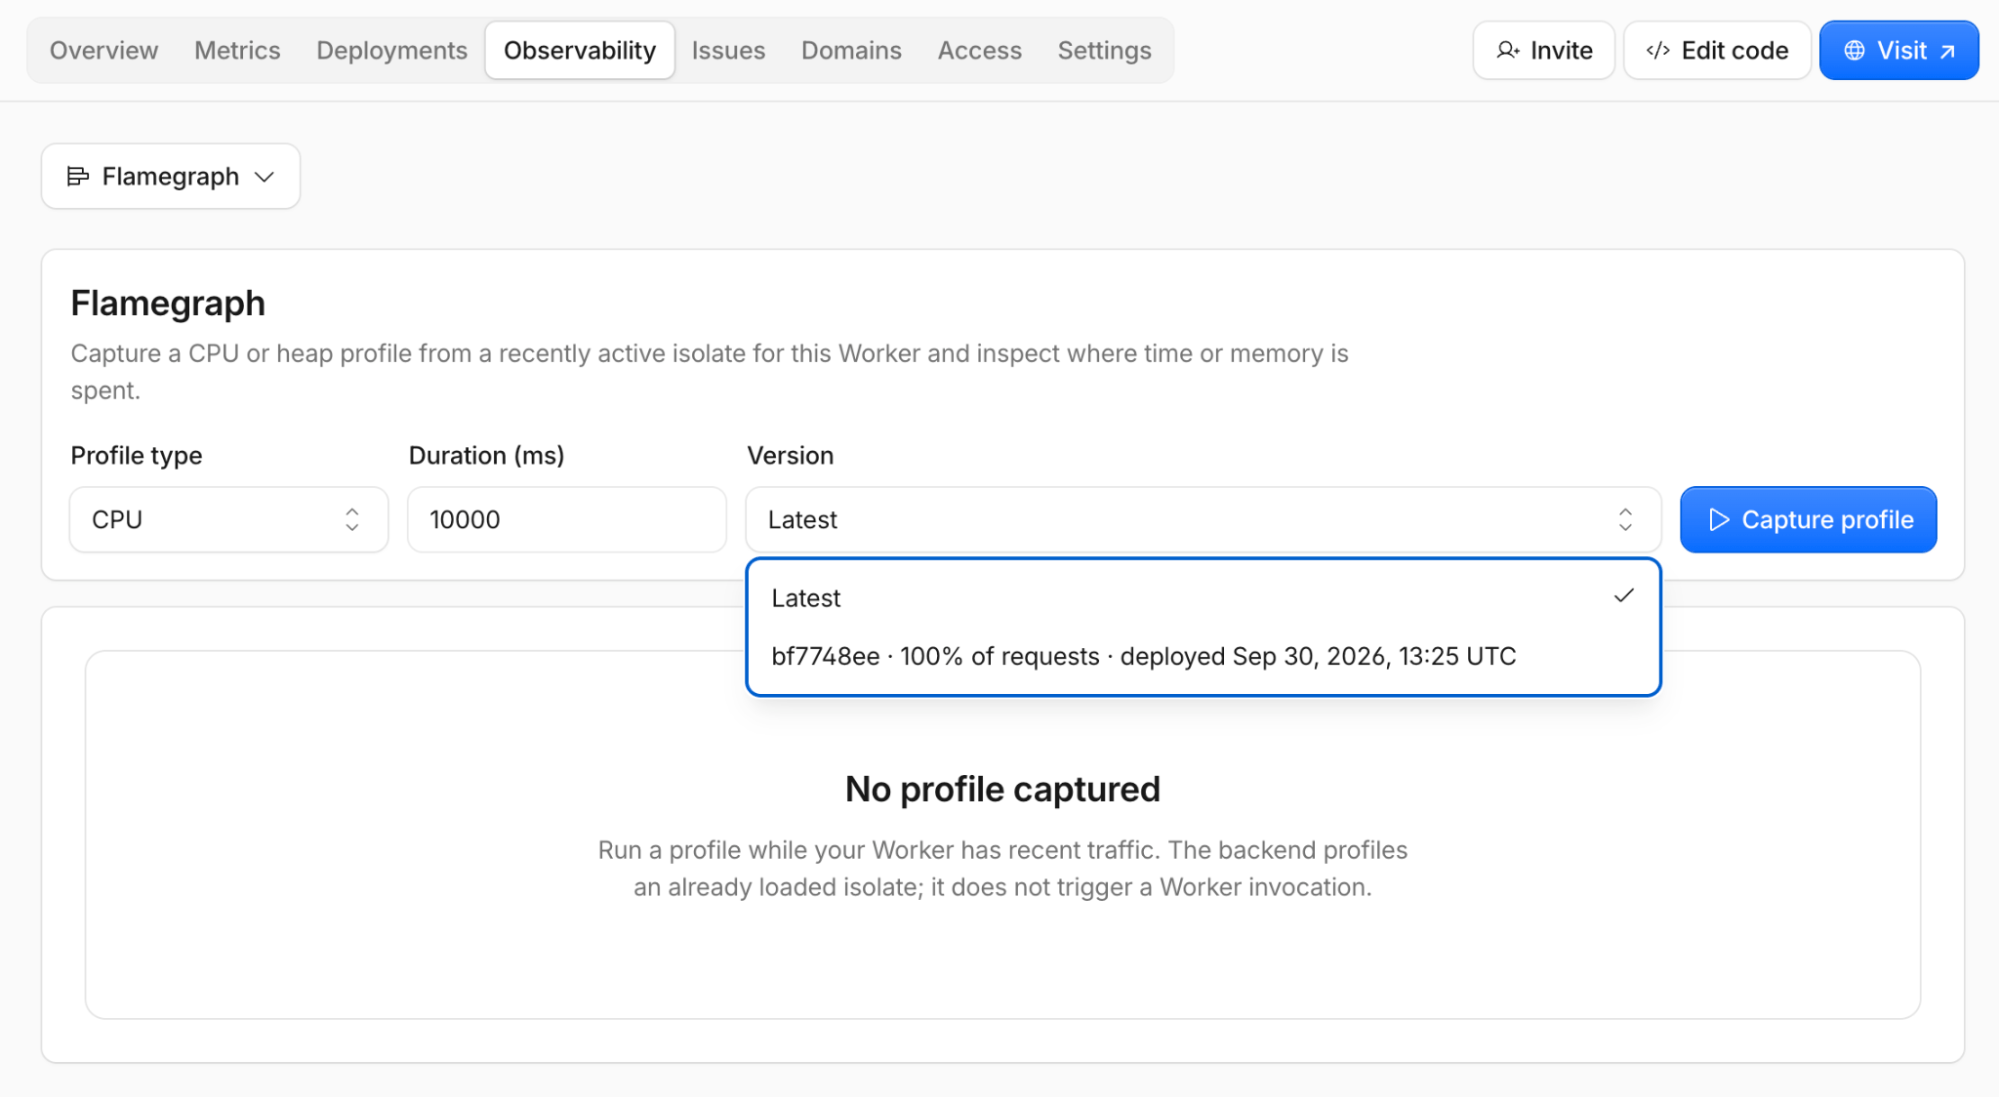
Choose CPU or memory profiling, the Worker version, and a collection duration, then select Capture Profile. The duration sets the collection window, not a guaranteed completion time. For TypeScript projects, enable source maps to avoid obfuscated function names.
Follow the widest boxes to the costly functions
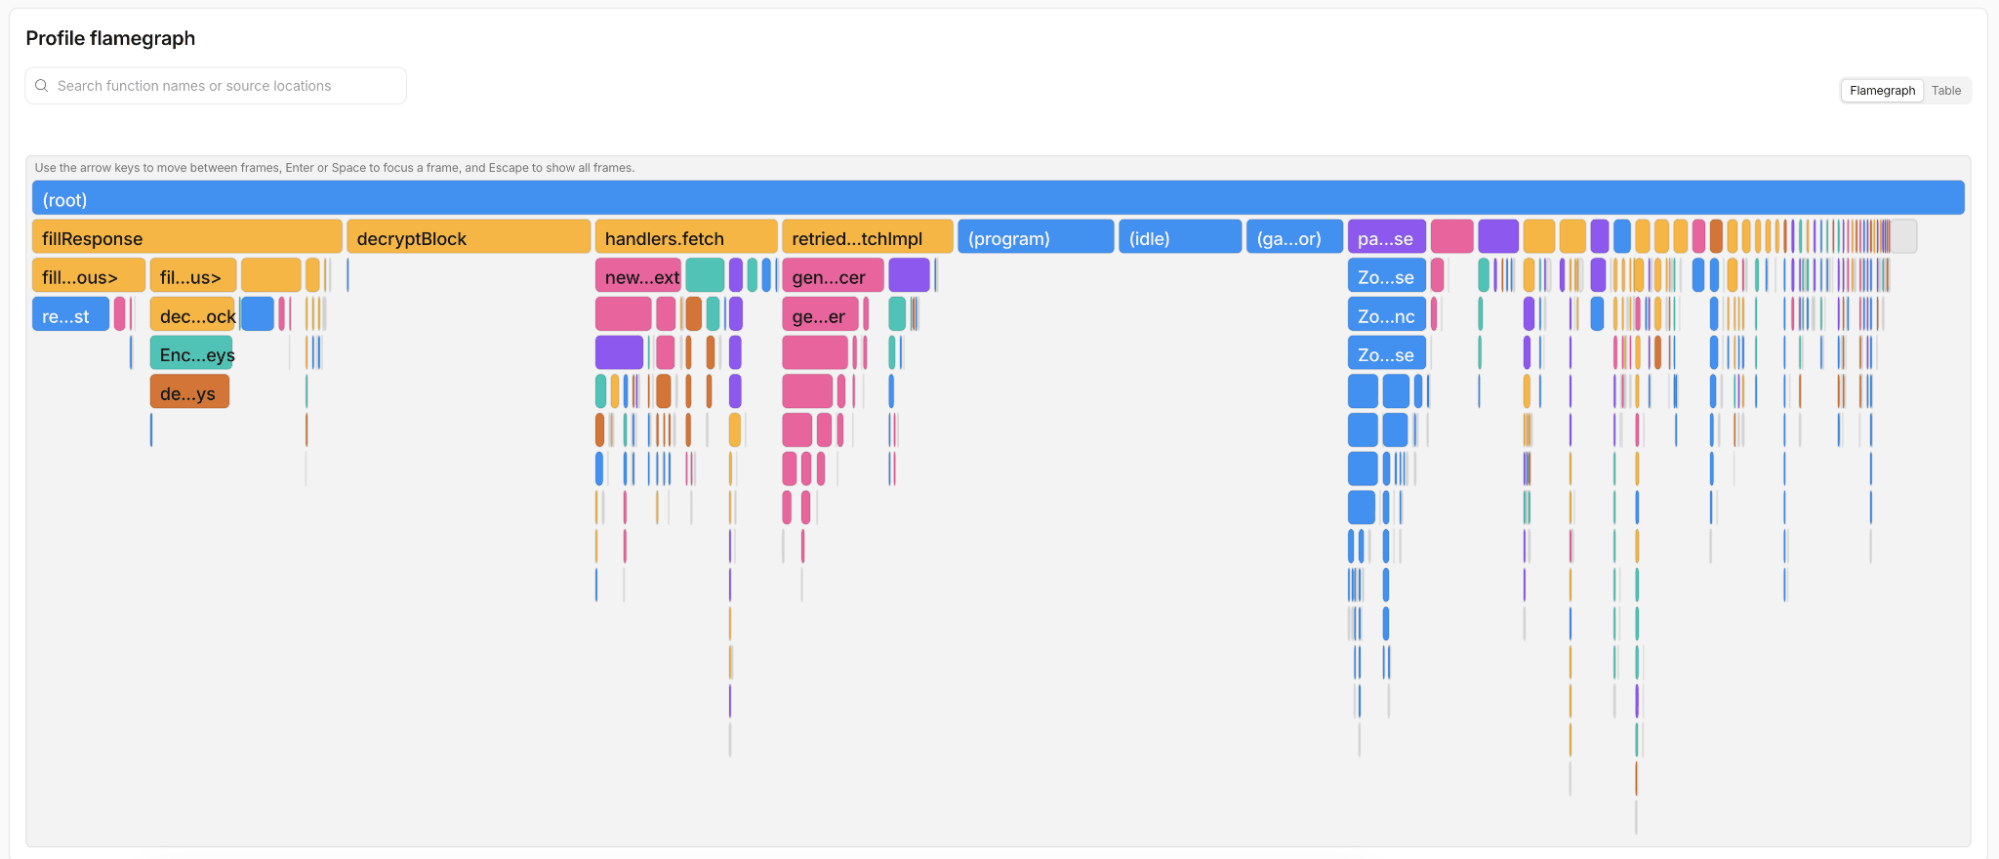
Each flamegraph rectangle represents a function call. Its width shows the call’s contribution to CPU time or memory use, depending on the profile type. Click a function to focus on it or hover for details; the table view also helps identify frequently sampled functions.
In Cloudflare’s internal R2-binding Worker example, genericR2JsonReplacer accounted for more than 5% of CPU time. The team found that it was recursively repeating work already performed during JSON serialization. Removing that duplicate work made the function itself 2.7 times faster.
For a regular Worker, profiling selects a running isolate of the requested version at random. Durable Objects allow a more specific target: choose an object by name, and the profiling request is routed to that live object.
What a capture can miss
A Worker needs an active deployed version with enough traffic. Cloudflare does not start a fresh isolate just to produce a profile, so very low traffic can make a capture difficult.
Memory profiles show only allocations made during the capture window, not historical heap contents or every retained object. Allocations made during start-up can therefore be missed.
Captures currently have to be started explicitly, so an intermittent problem may pass before you record it. Cloudflare is developing continuous profiling to collect samples automatically, but that feature has not launched.
Sources and checked date: October 10, 2026
Comments
0No login needed. Edit or delete your comment from the same browser.
All comments 0
한국어 · English · 日本語No comments yet. Start the conversation.